For librarians
Reading the reports
See your collection, usage, and demand at a glance on the Reports tab.
The Reports tab is the story you take to whoever funds the library: a collection that’s growing, books that get used, and demand worth acting on. No spreadsheets, no query writing.
The numbers at the top
A row of cards summarises the library:
- Titles and copies in the collection.
- Available now, out of the total.
- On loan, and how many are overdue.
- Loans in the last 30 days.
- Members, and how many are new this month.
- App accounts, and holds waiting.
Borrowing activity
A small chart shows loans per week over the last eight weeks, so you can see the trend at a glance rather than reading a table.
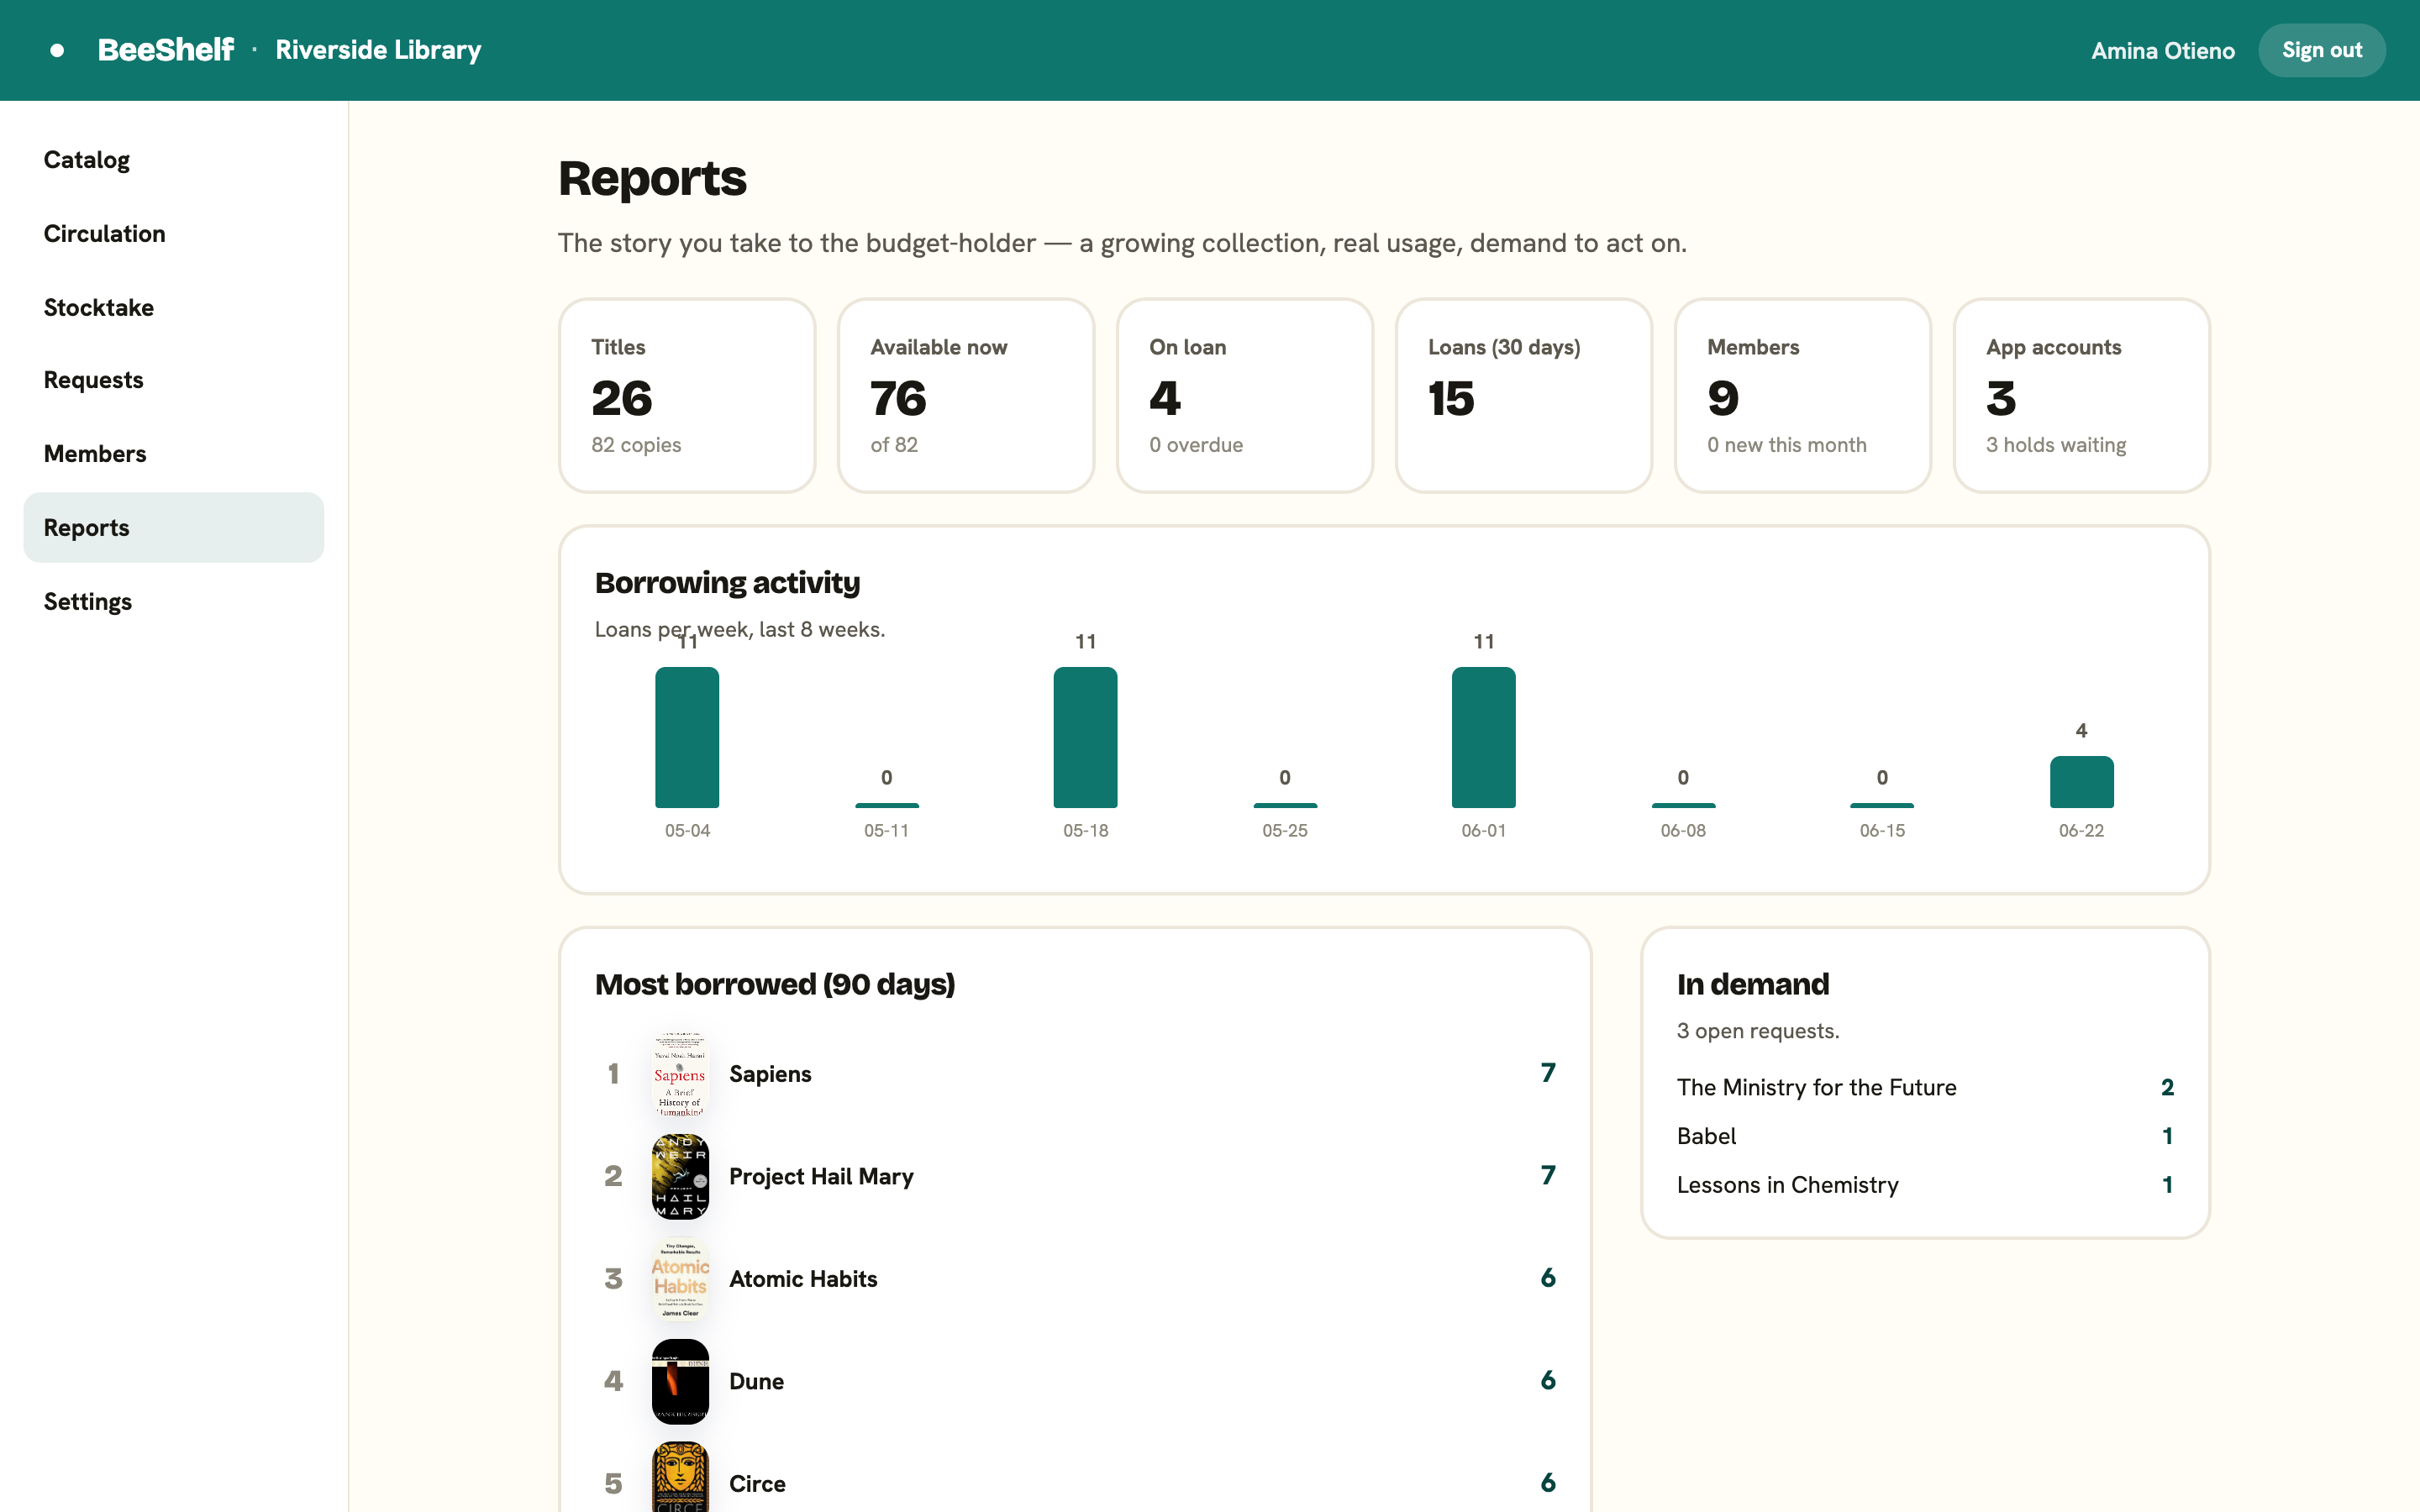
Most borrowed and In demand
Two lists sit below:
- Most borrowed (90 days) ranks the titles your readers actually use. Useful for buying more of what works.
- In demand shows open requests with their counts, drawn from the Requests tab. This is your evidence for what to buy next.
For a full copy of everything (members, holdings, loans, holds, requests), use Export library data under Exporting your data.